Bit of Context
Extracting tabular data from PDF has always been trouble for all kind of data analysts. You can find lot of paid OCR softwares, which are not entirely programmable and usually does not scale very well in production environment.
For good quality pdfs, Microsoft PowerBI Desktop software allows to easily extract and transform data from pdfs in batch. It is programmable with the M, Python and R languages, and the software is Free.
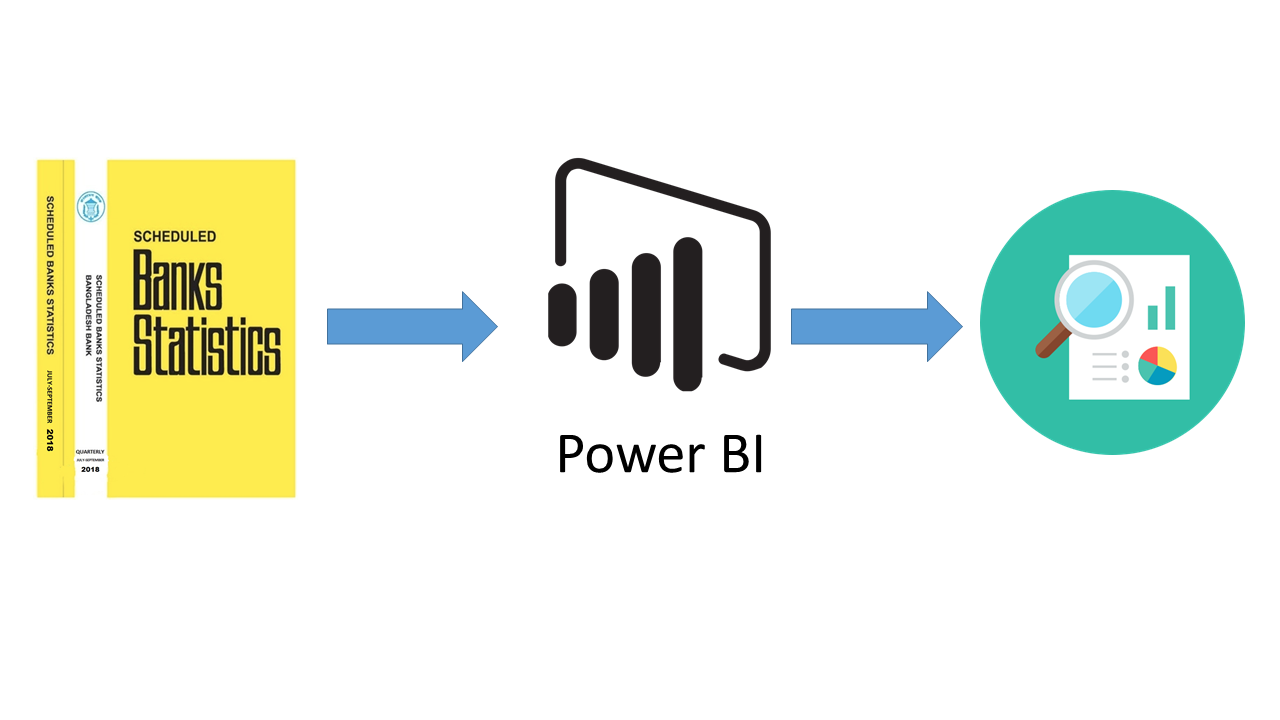
My work involves dealing with Bangladesh Bank data a lot, and a big portion of it comes from different pdfs. One of the most important datasets comes from Scheduled Bank Statistics(SBS) which is published quarterly. The table 1-13 file published with SBS provides data of district wise deposit and advance position. The first 4 Pages of the file contains this data. We will use PowerBI to extract this data in batch for 7 pdf files published in last reported seven quarters of 2017 & 2018.
Get Data from Folder, Combine & Edit
You can download the source data and completed powerbi file here.
To run the pbix file in your computer please follow the step in the post script below this article.
To batch import data from pdf, you first have to put all the pdfs in the same folder. Also, this only works for pdfs with same data format in all of them. I renamed all the files to the last day of each of the quarters, we will extract the date from this name later. The date format used in naming was “Year-Month-Day”.
Then, open up PowerBI Desktop and go to Home > Get Data > Folder and choose the folder where you have your pdfs saved.

In the resulting dialogue box, hit combine & edit.

In the dialogue box, you will see “First File” is selected by default, select one of the tables that you want to load, in my case i selected “Table002”. Hit “OK” and the query editor will generate codes to take our next actions.

Edit Custom Function
You can get to query editor by hitting Home > Edit Queries. You will see in the query pane on the left a sample query has been generated.

Right click on “Transform Sample File from table_1_13_2017_2018” and hit “Advanced Editor”.

In the editor, the generated code should look like the following

Replace the lines in the editor with the following lines
let
    Source = Pdf.Tables(#"Sample File Parameter1"),
    Table001 = Source{[Id="Table001"]}[Data],
    Table002 = Source{[Id="Table002"]}[Data],
    Table003 = Source{[Id="Table003"]}[Data],
    Table004 = Source{[Id="Table004"]}[Data],
    #"Append Query" = Table.Combine({Table001,Table002, Table003, Table004})
in
    #"Append Query"
You should see the following in the editor, Hit “Done”.

The goal is to select first 4 tables instead of one. We Combine the tables to create one table for each of the files, which gets merged to a big table that is “table_1_13_2017_2018”. Code to get to that merged table is already generated and we will start cleaning the data starting from that step.
Filter Rows
Hit the filter button on “Column1” and remove the tick from all the unnecessary data; that is all the items except the district names. This should remove all the unnecessary rows, and null rows.

Split Columns
The “Source.Name” column contains the name of the file which is basically the last day of each of those quarters. On the column name right click > Split Column > By Delimiter and in the dialogue box place a dot(.) as a delimiter. Hit OK to split the column.

Changed Type
In the newer version of PBI Desktop, after the split operation, the type of the “Source.Name.1” column should be automatically set to “date”. You can set the type manually by selecting the column and going to Transform Menu > Detect Data Type. Do that for columns that is still detected as text or “ABC123”.

Remove Columns
Select and Remove “Source.Name.2”, “Column4” & “Column6” as we don’t need them.

Rename Columns
Rename the columns “Source.Name.1” as “Date, “Column1” as “District”, “Column2” as “Population”, “Column3” as “Deposit”, “Column4” as “Advance”. You can rename by right click on a column then “Rename”

Multiply Columns with Lac
The Deposit & Advance columns are values in Lac. We need to multiply them by 100,000 to get proper figure. To do that, select each of the columns and go to Transform > Standard > Multiply and specify 100,000 value and hit OK. Do that separately for both Deposit and Advance.

Close & Apply
Now we have our data cleaned up and we can hit Close & Apply and go back to the visualisation view.

Make Visualization & Profit
You can check out the data by making a simple table visual or other kind of visualizations. I’ll show you how to do a map visualization with this data in one of the coming blog posts.
P.S. – How to use the example PBI file
To use the Example “table_1_13.pbix” file, you might need to change the data source from Power Query view, otherwise it will show error in in the Power Query Editor View. Select the table “table_1_13_2017_2018 from the left Queries pane, then from the right “APPLIED STEPS” pane double click on the “Source” step, which is the number one step, browse and show where the PDFs are kept. Hit “Refresh Preview” from the Home menu to see the affect. Hit “Close & Apply” to get the data in Dax View.


